|
 |
|||||
|
|
Sample Results
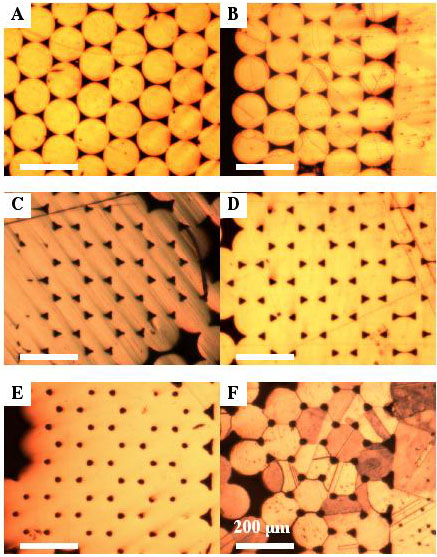
Figure 1. Optical micrographs from the Cu sintering experiment. An unannealed sample is shown in (A). The images labeled (B) through (E) were annealed at 1000°C in forming gas for 8, 20, 40, and 80 h, respectively. (F) shows and etched region of the 80 h sample. In each image, the scale bar is 200 microns. Image A Image B Image C Image D Image E Image F |
||||
|
|
|||||
