EBSD data
Grain Boundary line segment data
Grain Boundary Character and Energy Distributions
Grain Boundary Distribution plots and Images
Metadata
The data provided below was collected by Jia Li while at Carnegie Mellon University. The complete analysis of the data can be found in the following publication:
• J. Li, S.J. Dillon and G.S. Rohrer, "Relative Grain Boundary Area and Energy Distributions in Nickel," Acta Materialia, 57 (2009) 4304-4311.view paper
DOI: 10.1016/j.actamat.2009.06.004
EBSD data
In this project, there were five separate volumes of data collected. This is one of the volumes, which contains 30 parallel slices.
These are the original .ang files.
Download the data to your computer
These are the the same data on a square grid.
Download the data to your computer
Grain Boundary line segment data
This file contains all of the line segment data.
Download the data to your computer
Grain Boundary Character and Energy Distributions
This file contains grain boundary character distribution.
Download the GBCD file to your computer
This file contains grain boundary energy distribution.
Download the GBED file to your computer
Grain Boundary Distribution plots and Images
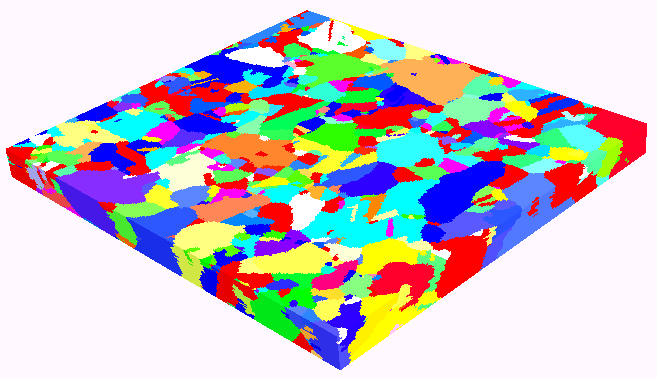
A three dimensional reconstruction, of one of the volumes, colored by orientation.
Disorientation angle distribution (blue circles). The red squares show a random distribution for comparison. Note the break in the vertical axis.
Download the program used to calculate the disorientation distribution
The distribution of misorientation axes for all grain boundaries with a 60 ° disorientation.
Download the program used to calculate the axis angle distribution
The distribution of grain boundaries planes, ignoring misorientation.
Download the program used to calculate the grain boundary plane distribution
The distribution of grain boundary planes at the sigma_3 misorientation.
The grain boundary energy as a function of orientation at the sigma_3 misorientation.
The correlation between the grain boundary population and grain boundary energy. For all GBs within an energy range of 0.025 a.u., the average energy and population is calculated and plotted on the graph.
data for the correlation plot
The relative grain boundary energies in Ni for [110] symmetric tilt grain boundaries.
data for the STGB plot
the distribution of grain boundary planes at the Sigma 9 misorientation
the distribution of grain boundary planes at the Sigma 19a, 27a, and 27b misorientations
the distribution of grain boundary planes at the Sigma 1, 5, 7, 11, 13a, 13b, 15, 17a, and 17b misorientations
the distribution of grain boundary planes at the Sigma 19b, 21a, 21b, 23, 25a, 25b, 29a, and 29b misorientations
the relative grain boundary energy as a function of grain boundary plane orientation the Sigma 19a, 27a, and 27b misorientations
the relative grain boundary energy as a function of grain boundary plane orientation the Sigma 1, 5, 7, 11, 13a, 13b, 15, 17a, and 17b misorientations
the relative grain boundary energy as a function of grain boundary plane orientation the Sigma 19b, 21a, 21b, 23, 25a, 25b, 29a and 29b misorientations
Download the program used to calculate the distribution of planes at specific misorientations
Download the program used to calculate the relative energy as a function of grain boundary plane orientation at specific misorientations
Download the program used to calculate the correlation between grain boundary population and energy
Download the program used extract grain boundary energy values for the [110] symmetric tilt grain boundaries